10 minus 5 Monitoring tools for your Nvidia GPUs
We present several simple to use monitoring tools to inspect your GPUs on your computer.
By Gregor von Laszewski (laszewski@gmail.com) laszewski.github.io | Sunday, May 30, 2021
1. Introduction
So you have installed your long-awaited graphics card from NVIDIA and like to observe its utilization. You may be familiar with nvidia-smi, but there is more to this tool as you may know. We will provide you with some examples of what you can do with it. Furthermore, we will showcase several tools that allow you to monitor the card(s) as they provide more sophisticated visualizations. We present graphics and terminal commands. The reason why terminal commands are so popular is that they can be called in containers, but also through simple remote shell invocations where it may be inconvenient to use a GUI.
Although we started with the hope that all of them are easy to install, we found out that only five of the 10 did install without issues. We found especially a lack of documentation on the other tools to make them work. Naturally, we have other things to do as likely you, so we did not spend any time trying to fix the things. Instead, we moved on and looked at other tools that are easier to install and work.
We hope with our review we safe you time.
2. Preface
- Notation: We use in the document some commands issued on the terminal, and prepend them with a ‘$’ to easily distinguish them from other text.
- Operating system: We restricted this review to tools that are available on Ubuntu as this is what we use to interact with the cards. Several tools also exist for windows, but this may be a topic for another day.
3. Python3 venv
Some of the tools come as python packages and in order not to effect your default python installation we recommend using a python virtual environment. We use in our virtual environment python 3.9. To do so make sure you have python 3.9 installed, which you can obtain in various ways.
Then create and source it and you should be ready to go after you execute the following commands:
$ python3 -m venv ~/ENV3
$ source ~/ENV3/bin/activate
$ pip install pip -U
To permanently add it to your startup, please add the line:
source ~/ENV3/bin/activateto your .bash_profile file
4. The tools to monitor your NVIDIA Cards
4.1 nvidia-smi
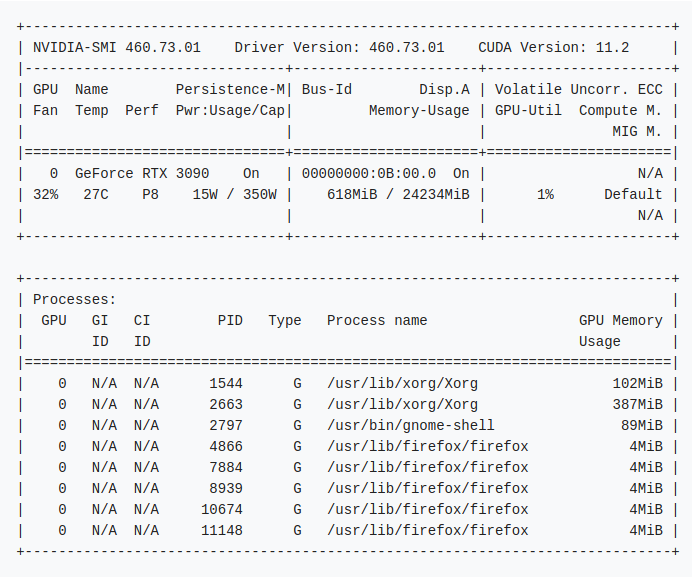
After you installed the Nvidia drivers and programs you will find a program called nvidia-smi. You simply can call it with
$ nvidia-smiThis gives you the current status of the cards.

To get a repeated update you can use the command
$ nvidia-smi -l 1where the parameter after the -l specifies the time in seconds between updates. However it to avoid past traces to be showing up in your command history, you can also use
$ watch -n 1 nvidia-smiwhich we prefer. Unkown to some users I spoke to they did not know that this command comes with a lot of features you can access from the command line to customize your query. To find out more about it use the commands
$ nvidia-smi --help-query-compute-appsand
$ nvidia-smi --helpto get inspired. Here is for example a command that returns the content of a specific query of selected attributes in csv format for further processing.
Examples are:
$nvidia-smi --query-gpu=timestamp,temperature.gpu --format=csv
timestamp, temperature.gpu
2021/05/30 10:39:37.436, 26$ nvidia-smi --query-gpu=name,index,temperature.gpu,utilization.gpu,utilization.memory,memory.total,memory.free,memory.used --format=csv,noheader,nounits
GeForce RTX 3090, 0, 30, 0, 0, 24234, 23512, 722
4.2 gpustat
gpustat is a minimal terminal command that lists a subset of nvidia-smi.
It is easily installable with
$ pip install gpustatyou can call it repeatedly with
gpustat -cp --watchor
watch -n 1 -c gpustat -cp --colorTo see more options use
gpustat -hThe output looks similar to
hostname Sun May 30 12:29:59 2021  460.73.01
[0] GeForce RTX 3090 | 27'C,   1 % |   659 / 24234 MB | gdm(102M) username(413M) ...
4.3 nvtop
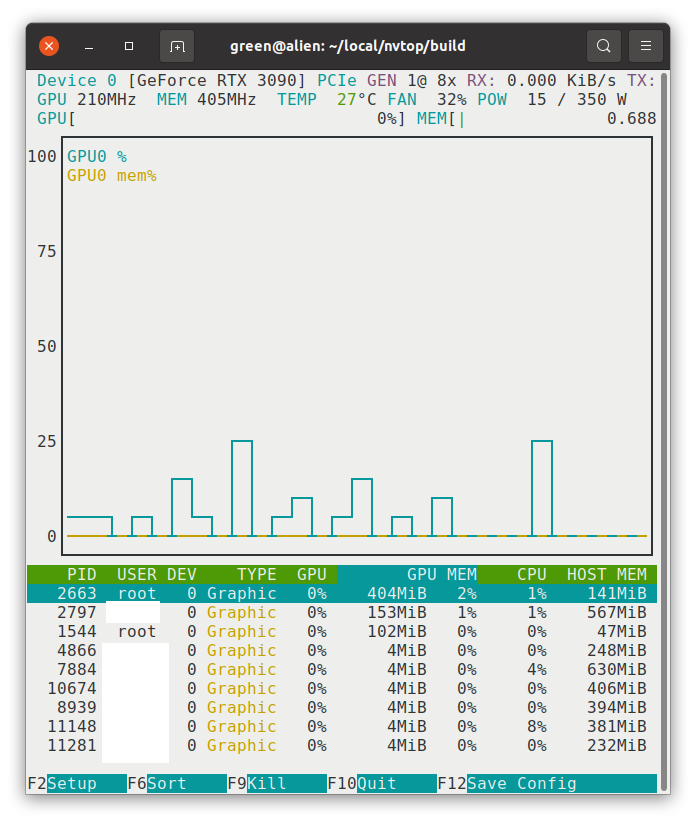
nvtop is a top-like task monitor for NVIDIA GPUs. It can handle multiple GPUs.
Nvtop could not be installed via pip install as it uses an outdated Nvidia library by default. Hence it is best to install it from the source as follows:
$ git clone https://github.com/Syllo/nvtop.git
$ mkdir -p nvtop/build && cd nvtop/build
$ cmake ..
$ make
$ sudo make install
Now run it with
$ nvtopThe output looks like

Figure: Nvtop Screenshot
4.4 gmonitor
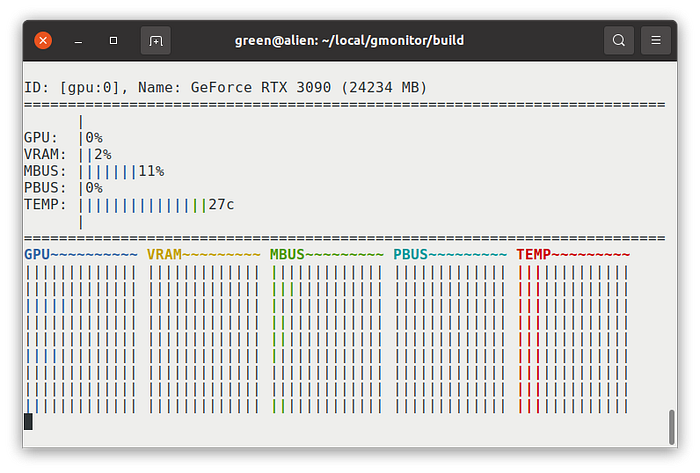
gmonitor is a simple GPU monitoring program for monitoring core usage, VRAM usage, PCI-E and memory bus usage, and the temperature of the GPU.
It is easy to install with
clone https://github.com/mountassir/gmonitor.git
cd gmonitor/
mkdir build
cd build
cmake ..
make
sudo make install
you start it with
gmonitorIt looks as shown in the next figure.

Figure: gmonitor
4.5 glances
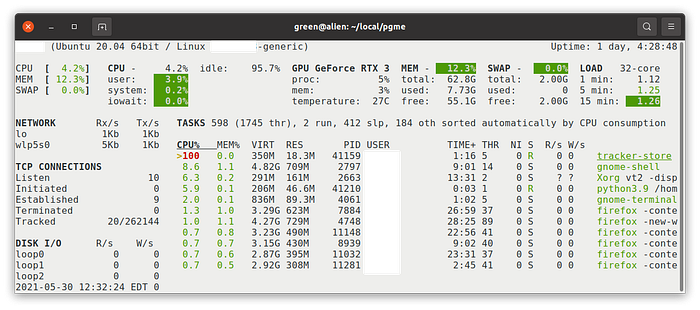
Glances is a top-like tool that reports on many different aspects of the system and not just GPUs. The tool is easy to install with
pip install py3nvml
sudo pip install glances[gpu]
You can start it with
$ glancesHowever, if you use a white background use
$ glances --theme-white
Note: All other tools listed here had installation issues. However, we did not spend time to debug them as any of the previous tools seem sufficient. However, some of the best looking GUI tools are in the list that did not install easily.
4.6 Install Issues: nvidia-system-monitor
As we have not installed qt we were suspicious about if this install would even work. Unfortunately, the documentation does not provide enough information on how to install qt. and make it work. The Web page for the tool is located at
It seems to be complex to install qt for free on a system, thus we have not followed up on this any further.
4.7 Install Issues: nvgpu
The Web page is located at Nvgpu
This module could not be easily installed even though we installed
sudo apt-get install liblzma-dev
sudo apt-get install liblzma
pip install -U nvgpu
nvgpu available
it returns
/home/USER/ENV3/lib/python3.9/site-packages/pandas/compat/__init__.py:97: UserWarning: Could not import the lzma module. Your installed Python is incomplete. Attempting to use lzma compression will result in a RuntimeError.4.8 Install Issues: nvitop
nvitop is Aa interactive NVIDIA-GPU process viewer, the one-stop solution for GPU process management. However, it is not installable on my system via pip install, not via compilation from the source.
The information on the Web site on how to fix the dependency on nvidia-ml-py==11.450.51 and how to fix it could be better described
4.9 Install Issues: GreenWithEnvy
GreenWithEnvy is a great-looking application, however, also its install is not possible on my system as it fails with an install issue of pycairo. The ode is available on GitLab
4.10 Install Issues: pgme
The tool pgme could not be installed on Linux as its instructions were incomplete and did not work even after installation of go with
sudo snap install go --classic5. Conclusion
We have shown you several tools for monitoring your GPUs. We found that these tools are incredibly useful to make sure your system operates properly. This is especially the case for showing workloads and temperatures, as well as the available software versions to interact with the cards.
Which one of the tools you like maybe a personal choice. Although nvidia-smi is the go-to tool, others provide quite good insights while visualizing historical trends enhancing the experience when you for example, run workloads over time.
We naturally like nvidia-sm as it simply works and you can customize its output, while repeatedly displaying its values with watch.
Form tho other tools we liked nvtop do its graphical history, ‘gmonitorfor displaying the values in a diagram, andglancesfor more then GPU information. If you are really tight in space,gpustat` may be for you. All other tools could unfortunately not easily be installed.
Please leave us a note about which tools you prefer and let us know about tools that we have not listed here. Make sure they can easily be installed. If you have better instructions on how to install the tools with issues on Ubuntu 20.04 LTS please comment or provide us a pointer. We will then try it out and update this post.
